

Series: Clustering Sterling B2B Integrator – Part 1: Why Cluster · Part 2: Architecture · Part 3: Load Balancing · Part 4: Control & Recovery · Part 5: Adapters & Edge · Part 6: Capacity & Failover
Before you can tune a cluster you need to know what runs inside each node and how nodes find each other.
The components
- Core engine: executes business processes (BPs).
- Services & adapters: execute BP steps and talk to the outside world (databases, ERP, CRM, protocols).
- Operations Controller: manages resources across JVM boundaries.
- Services Controller: manages, configures, queries, and caches everything related to services and adapters.
- Central Operations Controller (COC): the single point of contact for operational questions. It coordinates with the Operations Controllers.
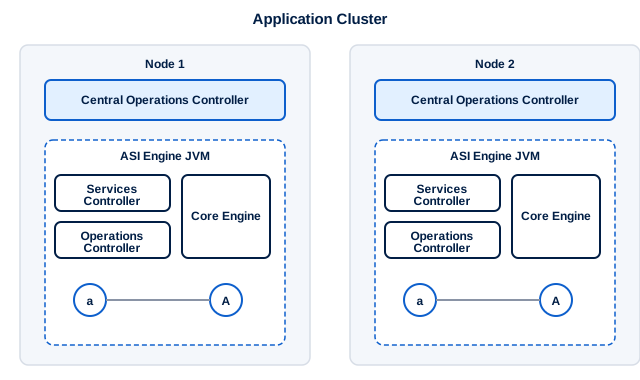
Fig 2.1 – Two-node application cluster. Each node runs its own Central Operations Controller beside an ASI (Application Server Independent) engine JVM. Lowercase “a” and uppercase “A” are two halves of the same adapter: one half sits with the Services Controller, the other inside the core engine.
How nodes find resources: JNDI backed by the database
ASI clustering locates resources (application servers, adapters, and more) through JNDI. Each node runs its own JNDI server. At startup a node registers by writing its status to the database, which is how the other nodes discover it. Resources that change slowly – adapters, for example – have their locations stored in database tables, and JNDI refreshes from those tables.
Field rule: When a cross-node call fails (a failed RMI invocation), the cause is nearly always a misconfigured port or a misconfigured adapter. Check those two first.
Pinning RMI ports through a firewall
If there is a firewall between nodes, RMI’s habit of opening random ports will break the cluster. Pin the ports. The example below uses two nodes, both with base port 5000, at 10.8.164.4 and 10.7.164.4, and opens exactly three extra RMI ports (5101-5103). Put it in customer_overrides.properties on each node.
Node 1 – customer_overrides.properties
noapp.useSocketFactories=true
noapp.jnp_host=10.8.164.4
noapp.jnprmiport=5101
noapp.jndirmiport=5102
noapp.jnprmiport2=5103
ops.jnp_host=10.8.164.4
ops.useSocketFactories=true
ops.jnprmiport=5101
ops.jndirmiport=5102
ops.jnprmiport2=5103
Node 2 – customer_overrides.properties
noapp.useSocketFactories=true
noapp.jnp_host=10.7.164.4
noapp.jnprmiport=5101
noapp.jndirmiport=5102
noapp.jnprmiport2=5103
ops.jnp_host=10.7.164.4
ops.useSocketFactories=true
ops.jnprmiport=5101
ops.jndirmiport=5102
ops.jnprmiport2=5103
The pattern is the same on both nodes: the noapp.* (engine) and ops.* (operations) prefixes get the same port triplet, and jnp_host is the node’s own IP. Your firewall rule then reads “allow 5101-5103 between cluster members.”
Workflow queuing: nine priorities, one scheduler
For most servers, the best thread count is a small multiple of the CPU count. A busy node always holds far more BPs than it has threads, so the extra work waits in a queue.
- There is one queue per priority, 1-9.
- Each queue has its own thread allocation.
- A BP runs a configurable number of steps (the execution cycle), then goes back to its queue.
- Only one scheduling policy is active at a time. It decides how resources are split between queues.
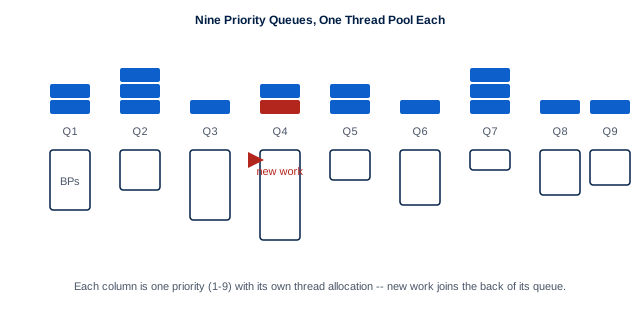
Fig 2.2 – Threads per priority queue. Each column is a priority (1-9) with its own thread pool. Some queues get more threads than others, which is how mixed workloads are prioritized. New priority-4 work joins the back of queue 4.
The two scheduling policies
| Policy | Behavior | Use when |
|---|---|---|
| Basic | Static thread count per queue | The workload is stable and you want predictability |
| Fair Share | Each queue is given a share of the resources, and the policy enforces that share over time | Mixed priorities, and you don’t want any queue starved |
To save memory, waiting BPs can be cached to disk. Parameters control when and how. Contexts are split into “small” and “large,” and the cutoff for “small” is itself a setting.
Takeaways
- Nodes register in the DB, and JNDI is refreshed from DB tables.
- Pin
jnprmiport,jndirmiport, andjnprmiport2for bothnoappandopswhen a firewall separates nodes. - Threads ≈ a small multiple of the CPU count. Everything else waits in nine priority queues.
- The length of the execution cycle decides how often a BP can move to another node – more on that in Part 3.
← Part 1: Why Cluster | Next: Part 3: How a cluster decides where your business process runs →