

Series: Clustering Sterling B2B Integrator – Part 1: Why Cluster · Part 2: Architecture · Part 3: Load Balancing · Part 4: Control & Recovery · Part 5: Adapters & Edge · Part 6: Capacity & Failover
There is no central dispatcher. Each node decides for itself, every time a BP enters a queue, whether to run it locally or push it to a peer.
Two layers of load balancing
- External: network load balancers spread incoming HTTP, FTP, and other traffic across nodes (covered in Part 5).
- Internal: the active scheduling policy redistributes BPs between nodes.
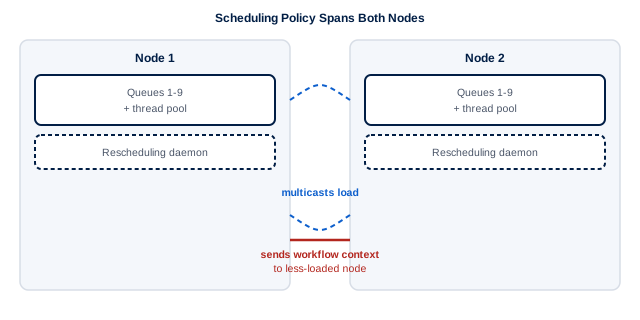
Fig 3.1 – The scheduling policy spans nodes. Each node has queues 1-9, a thread pool, and a rescheduling daemon that sends waiting BPs back through the policy. The policy does two things: it multicasts load to every peer, and it sends workflow contexts point-to-point to a less-loaded node.
The load factor
Every few seconds each node announces its load factor over multicast. The load factor estimates how long a newly queued BP will wait before it runs. It is calculated from:
- the average time BPs in a queue run before giving up the CPU, and
- the number of BPs waiting in that queue.
When a BP is queued, the node compares its own load factor with its peers’. If the gap exceeds a configurable threshold percentage, the BP goes to the least-loaded peer. The default FairShareSchedulingPolicy starts distributing once some node carries about 10% more load than the others.
Distribution decision:
- BP enters a priority queue – on first queueing, or when the rescheduler re-evaluates a waiting BP.
- Compare load factors – is the gap to the least-loaded peer above the threshold? If not, run locally.
- Hand off over a socket – send the workflow context to the peer with the lowest load factor.
- (failure path) Peer refuses or times out – put the context back in the local queue and mark the peer suspect. It returns to rotation after its next multicast.
Failure handling: “suspect” nodes
If a distribution attempt fails, nothing is lost. The context goes back into the local queue, and the target node is marked suspect. A suspect node gets no more work until it announces over multicast that it is healthy.
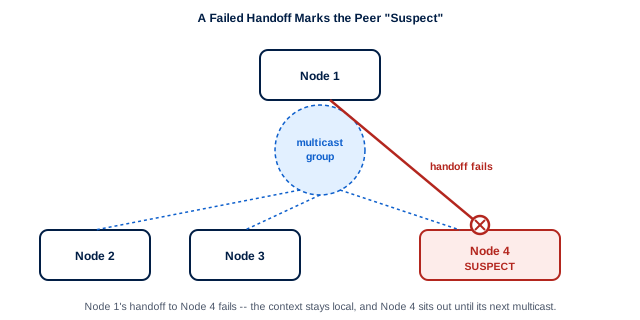
Fig 3.2 – Multicast group and a suspect node. Load is announced to a multicast group (address + port). Work is handed off point-to-point over a socket. Node 4 refused a handoff, so it stays out of rotation until its next multicast.
Multicast: the details that bite
- Multicast reaches only nodes that have registered for that address and port. Your routers must have multicast enabled, and router scoping (one segment versus a subset of the network) is both a security control and a common cause of breakage.
- Multicast addresses and ports are derived from the base port. Nodes may use different system base ports, but they must share the same multicast base port.
- All nodes should be on the same subnet.
- Communication is per node, not per queue: one multicast socket and one distribution socket per node, covering all nine queues. Per-queue sockets would mean at least 20 sockets per node, which hurts when you pack several nodes onto one host.
Production gotcha: cloned environments. A test copy of production that uses the same multicast ports on a reachable network will receive production’s packets. If both connect to the same database they merge into one cluster. If they use different databases, each rejects the other’s packets and fills the logs with exceptions. Fix it by putting the copy on a separate segment with routers scoped to that segment, or by giving the clusters different multicast ports.
JGroups: when multicast is not allowed
JGroups gives you the same load-broadcast mechanism over a choice of transports, plus proper group membership: join and leave notifications, failure detection, and tunneling through firewalls for clusters spread across sites.
Attribute (jgroups_cluster.properties) |
Default | Purpose |
|---|---|---|
property_string |
UDP (IP multicast) | Broadcasts the BP load factor |
distribution_property_string |
TCP (unicast) | Hands workflow contexts between nodes. Never set this to UDP. |
Switch property_string to TCP when your security policy disables UDP multicast, or when multicast becomes a bottleneck across a WAN. With TCP on both channels, the TCPPING initial_hosts list must name every host in the cluster.
Alternative: cost/weight-based balancing
The default queue-depth method only considers distribution once every active thread in the node’s queue is busy. The cost/weight method lets you say that some BPs are heavier than others.
- Each BP gets a weight of 1-9 (default 3).
- A node’s weight is the sum of the weights of BPs in active threads and in the queue. That sum is what gets multicast, in place of queue depth.
- You use one method or the other, never both.
noapp.properties_platform_ifcresources_ext.in
DistributionOnWeight=true     # default false
DistributionThreshold=20      # % imbalance before distributing; default 20
Distribution formula
imbalance = (current_node_weight - minimum_weight) / current_node_weightWorked example: Node A has 4 heavy EDI translations (weight 8) and 6 light routing BPs (weight 2), so 32 + 12 = 44. Node B weighs 30. Imbalance = (44 - 30) / 44 ≈ 32%. That is above 20%, so A sends its next BP to B. Once the weight feature is on, set each BP’s weight in the Set Business Process Weight field on the Process Levels page of the BP editor.
Tuning distribution: the tank model
Think of each queue on each node as a tank, with BPs as the liquid. The pipe between the tanks has a valve, and that valve is the threshold.
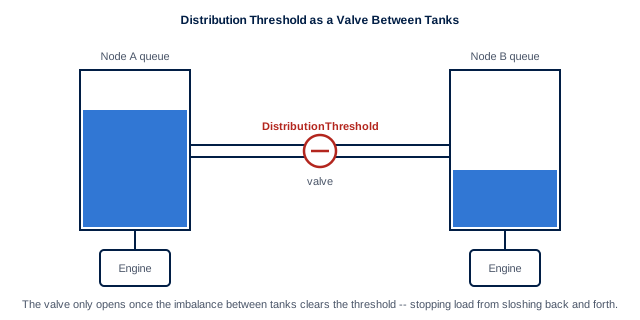
Fig 3.3 – Distribution as connected tanks. DistributionThreshold stops the liquid sloshing back and forth. Turnover (how fast each tank drains into its engine) depends on thread count and cycle length. A BP is considered for distribution when it is queued, or later when the rescheduler re-evaluates it.
| DistributionThreshold | Effect |
|---|---|
| 100% | No load balancing at all |
| 20-40% | A good range for most workloads. Benchmark to confirm. |
| 1% | Thrashing: load sloshes between nodes on every small imbalance |
Rescheduling gives BPs that are already waiting a second chance to move if they meet certain criteria. Your workload shape (cycle length, thread layout, which services run and how much data they move) matters more than the threshold. Some workloads scale almost linearly, so twice the nodes gives about twice the throughput. If one non-clusterable adapter is the bottleneck, extra nodes gain almost nothing.
Takeaways
- Each node decides for itself, using load factors announced every few seconds.
- A failed handoff means the BP runs locally and the target is marked suspect.
- All nodes must share one multicast base port. Isolate cloned environments.
- JGroups: the load channel may be UDP or TCP. The distribution channel is always TCP.
- Threshold 20-40%. Fix the workload’s shape before tuning the threshold.
← Part 2: Architecture | Next: Part 4: Pinning work, holding the token, and recovering from a dead node →